
Your keyword difficulty baseline is the median KD score of keywords your site currently ranks for in positions 1 through 5. It is the single most important number in your keyword research process, and most SEO practitioners have never calculated it.
Without it, you are picking keywords based on gut feel and hoping the difficulty score is low enough to compete. With it, you have a site-specific, data-backed filter that tells you exactly which keywords you have a realistic chance of winning, and which ones you are not ready for yet.
This guide goes beyond the standard “check the KD score before you target a keyword” advice. We are going to cover how to calculate your baseline precisely, how to segment it by topic cluster, how AI Overviews are changing the click-through equation for low-KD keywords, and how to recalibrate your baseline as your site grows.
Let’s get into it.

What Is Keyword Difficulty? (And Why the Score Alone Isn’t Enough)
Keyword difficulty is a 0–100 metric that estimates how hard it will be to rank organically on the first page of search results for a given keyword. Zero is the least competitive. One hundred is the most. Every major SEO tool uses this scale, but that is where the consistency ends.
Here is the core problem. A KD score is an absolute number. Your ability to rank is relative to your site’s current authority. A KD of 40 might be well within reach for a site with a Domain Authority and strong topical authority. For a site that launched six months ago, that same KD of 40 is a wall. The score did not change. Your position relative to it did.
This is why you need a baseline. The KD score tells you how competitive a keyword is in the abstract. Your baseline tells you where that keyword sits relative to what your site has already proven it can rank for. That distinction is everything.
Here is how the same keyword looks across four different tools:
| Keyword | Ahrefs KD | Semrush KD | Ubersuggest KD | KWFinder KD |
|---|---|---|---|---|
| keyword difficulty baseline | 7 | 40 | 12 | 37 |
| domain authority | 85 | 87 | 91 | 60 |
| on-page SEO checklist | 40 | 27 | 72 | 32 |
| organic keyword research | 94 | 33 | 75 | 40 |
The same keyword, four different scores. The term “on-page SEO checklist” has a KD of 40 in Ahrefs but 27 in Semrush. If you are mixing scores from multiple tools without knowing this, your baseline is already broken before you start. Be sure to use the same tool across the board to get accurate results.
How SEO Tools Calculate Keyword Difficulty Differently
Each tool uses a different methodology to arrive at its KD score:
- Ahrefs: bases KD primarily on the number of referring domains pointing to the pages currently ranking in the top 10. It is a backlink-centric model, the more links the top-ranking pages have, the higher the KD. This logic traces directly back to Google’s original PageRank algorithm, which treated links as votes of confidence, and despite two decades of updates, link equity remains the backbone of how most KD models assess competitive difficulty. You can read more about how Ahrefs calculates keyword difficulty directly from their team.
- Semrush: uses a weighted combination of factors, including page authority, backlink profiles, and SERP feature presence. It tends to produce higher scores than Ahrefs for the same keywords.
- Ubersuggest: calculates KD using a composite of backlink profiles, page authority, and content quality across the top 10 results.
- KWFinder: uses a proprietary formula that factors in link authority and on-page signals, and generally produces scores closest to Ahrefs.
None of these is objectively correct. They are each a model, an estimate. What matters is that you pick one tool as your baseline source and use it exclusively. Mixing scores from Ahrefs and Semrush in the same spreadsheet produces a number that means nothing.
I use Ahrefs for every baseline calculation I run. Pick your tool, stay consistent.
KD Score Ranges: What the Numbers Actually Mean for Your Site
Understanding where your baseline sits on the broader KD scale gives you important context, especially when comparing your position against competitors or setting growth targets.
| KD Range | Difficulty Level | Typical Site Profile | Content Requirements | Link Building Needed | Estimated Time to Rank (website-dependent) |
|---|---|---|---|---|---|
| 0–10 | Very Easy | Brand new sites, niche topics | Basic, well-structured content | Minimal | Weeks |
| 11–30 | Easy | New to growing sites, limited authority | Solid, thorough content with good on-page SEO | Low to moderate | 1–3 months |
| 31–50 | Medium | Growing sites with some established authority | In-depth content, strong E-E-A-T signals | Moderate | 3–6 months |
| 51–70 | Hard | Established sites with solid domain authority | Comprehensive, expertly written content | Significant | 6–12 months |
| 71–100 | Very Hard | Major brands, high-authority domains | Best-in-class content with serious link equity | Aggressive | 12+ months |
One important nuance: KD scores do not account for industry. A KD of 40 in B2B SaaS is a very different proposition than a KD of 40 in health or personal finance. YMYL (Your Money or Your Life) YMYL categories attract more authoritative competition and are held to a higher standard by Google’s quality raters. If your site operates in one of these spaces, treat every KD score as if it is 10 points higher than it reads.
How to Calculate Your Keyword Difficulty Baseline (Step-by-Step)
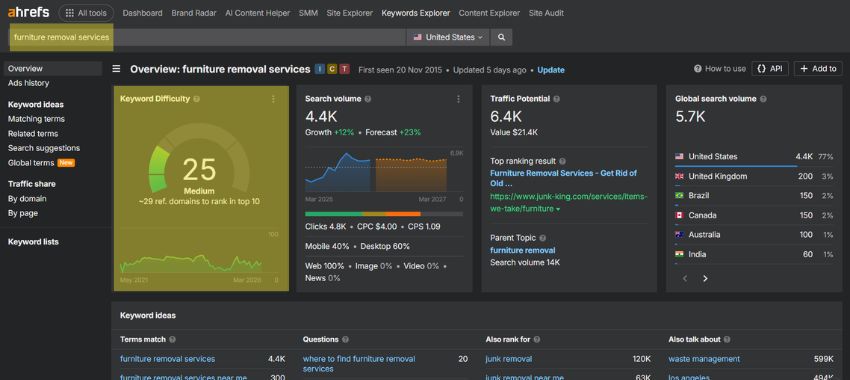
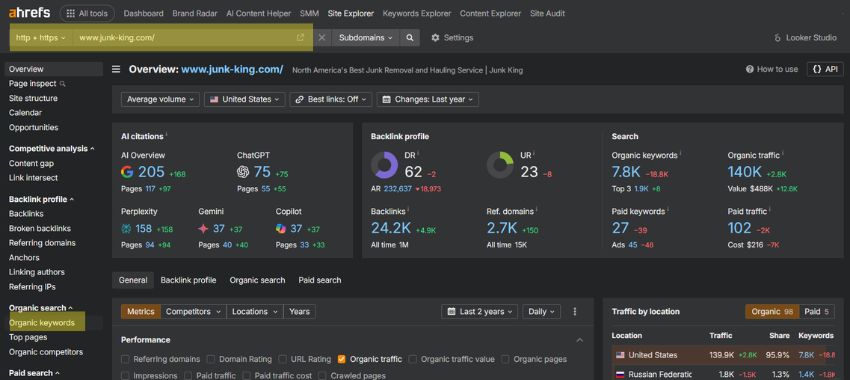
This is the core of the entire process. Follow these five steps in order, and you will have a precise, actionable baseline by the time you are done. For this walkthrough, we will look at Junk King
Step 1: Export Your Ranking Keywords (Positions 1–5)
You need a complete list of every keyword your site currently ranks for in positions 1 through 5. (Note: Looking at keywords you currently rank for in positions 1 through 5 is just a rule of thumb, and that’s what I will use for this walkthrough.)
Keep in mind. This is website-dependent as well. You want to make sure you have a large enough data set to get an accurate result. If you have a smaller website, or one that doesn’t rank for a lot of keywords in the top five positions, you may want to expand to positions 1 through 8 or 10.
Conversely, if your website has a lot of keywords in the 1 through 5 positions, you could also shrink that back to 1 through 3. This would give you better targeting, but only if you have a large enough universe of keywords ranking in those top three positions.
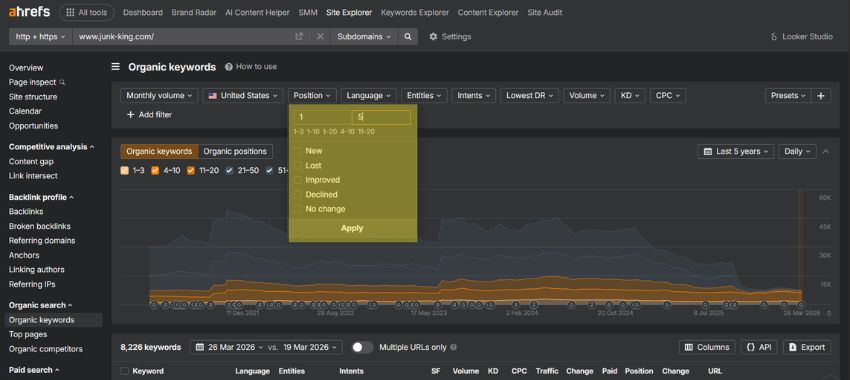
Using Ahrefs (My personal preference): Open Ahrefs Site Explorer, enter your domain, and navigate to Organic Keywords in the left-hand menu. Set the position filter from 1 to 5 and click Apply. Ahrefs will return every keyword your site ranks for within that range, along with KD scores already included in the export. Click Export and download the CSV or Google Sheets.
Step 2: Calculate the Median KD as Your Numeric Baseline
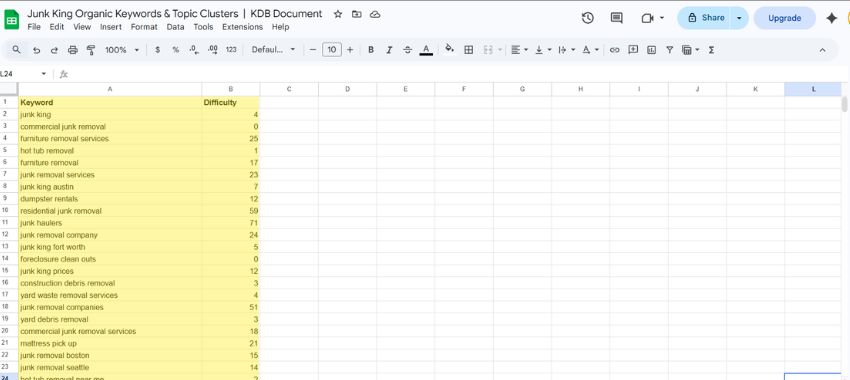
Open the CSV file or Google Sheet, and you will see a bunch of different metrics. We are only interested in two “Keyword” and “Difficulty”. Next, open a new spreadsheet, then copy and paste both columns into the new spreadsheet.
After we have pasted both the “keyword” and “difficulty” columns, we need to create a frequency formula to see where all current keywords fall inside the zero to 100 difficulty ranking scale. Start by creating two new bins of data for the frequency formula. The first bin will be named “Difficulty Bin”. In this bin, add the numbers from 0 to 100, by fives. This will represent the ranking scale.
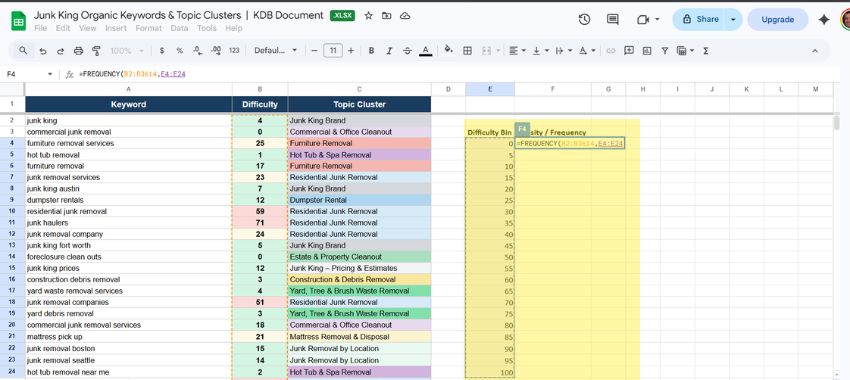
The second bin will be named “Density / Frequency”. This will represent the number of keywords that fall inside each five-point difficulty bucket. Click inside the cell directly under your density heading and start adding the frequency formula provided here: =FREQUENCY (
Next, click inside the first cell under difficulty on this sheet, it is the (B2) cell, then drag your mouse down the page until you have highlighted all the numbers in the column (B3614). This will automatically populate the next part of the formula inside the parentheses section. Your formula will now look something like this: =FREQUENCY (B2:B3614
Placing a comma. This will allow you to add a second set of variables. Your formula should now look like this: =FREQUENCY (B2:B43614,
To complete the formula, click inside the first cell under density. Again, drag your mouse down the page until you have highlighted all the numbers inside the column from zero to 100. This will automatically populate the next part of the formula inside the parentheses section after your comma. Your formula will now look something like this: =FREQUENCY (B2:B3614, E4:E24
Then, close the section with a final parenthesis =FREQUENCY (2:B4020, E4:E24) and hit enter. Your keyword density will now be populated per difficulty level. Now you are able to see the density of your keywords in each difficulty bucket.
Step 3: Visualize the Distribution with a Frequency Chart
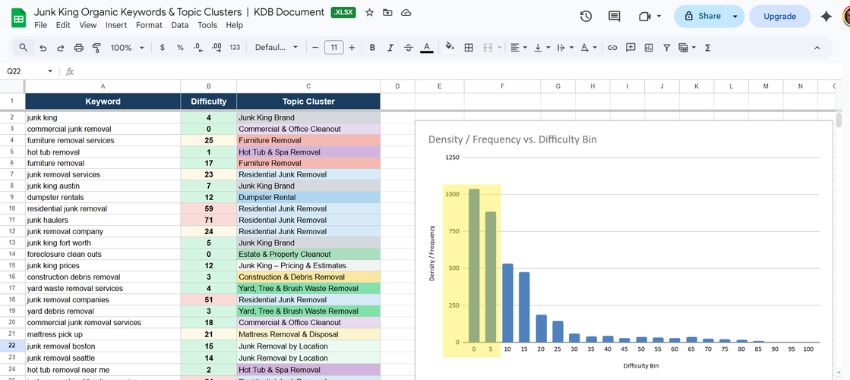
To make the data easier to see, display it in a column chart. Highlight the difficulty and density columns together and click the “Insert Chart” button located in the menu bar. By default, Google Sheets will produce a scatter chart. Click on Setup → Chart Type → and choose Column Chart.
You can now easily see your website’s keyword difficulty baseline. Here is how to read it. The tallest bar shows where your site currently competes most successfully. That is your baseline zone, which is exactly what you need for targeting decisions. For this website, the baseline falls between difficulty levels 0 and 5.
In this scenario, nearly 50% of Junk King’s 3,613 ranking keywords sit in the KD 0 to 5 range. The distribution drops steeply after KD 20 and flattens into a long tail of harder keywords the site ranks for, but does not dominate. The competitive sweet spot is clear: KD 0 through 10. That is where the majority of this site’s proven ranking ability lives.
Let’s say the website you are reviewing has a keyword difficulty baseline between 55 and 65. Starting at the bottom end of your baseline, move backward 10 to 15 points. Since the baseline for this website is between 55 and 65, I would target keywords with a difficulty between 40 and 55. That would be the competitive sweet spot for that website.
Step 4: Segment by Topic Cluster for Nuanced Baselines
Your site-wide baseline is useful. A cluster-level baseline is more powerful.
Your site does not have uniform authority across every topic you cover. You may have spent three years publishing content about SEO and built strong topical authority there, but only six months publishing about email marketing. Your ability to rank in those two topic areas is meaningfully different, even on the same domain.
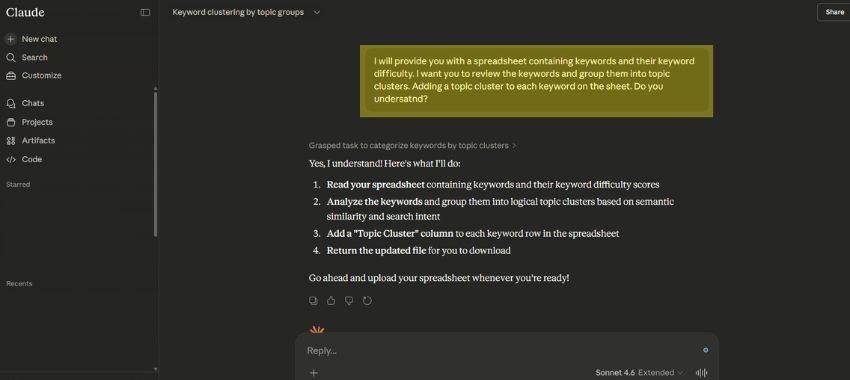
Add a Topic Cluster column to your keyword spreadsheet and tag each keyword with its relevant cluster. Then, calculate a median KD per cluster using a pivot table. To do this, take the spreadsheet you created with “Keyword” and “Difficulty”, upload it into Claude, and ask it to review the keywords and group them into topic clusters. Adding a topic cluster to each keyword on the sheet. (Here’s my exact prompt: I will provide you with a spreadsheet containing keywords and their keyword difficulty. I want you to review the keywords and group them into topic clusters. Adding a topic cluster to each keyword on the sheet. Do you undersatnd?)
Claude will create a new spreadsheet that includes Topic Clusters. Create a new table for each cluster you want to review and repeat steps 2 and 3 to find the cluster-level keyword difficulty baseline. I completed one for “Residential Junk Removal” and “Dumpster Rental.”
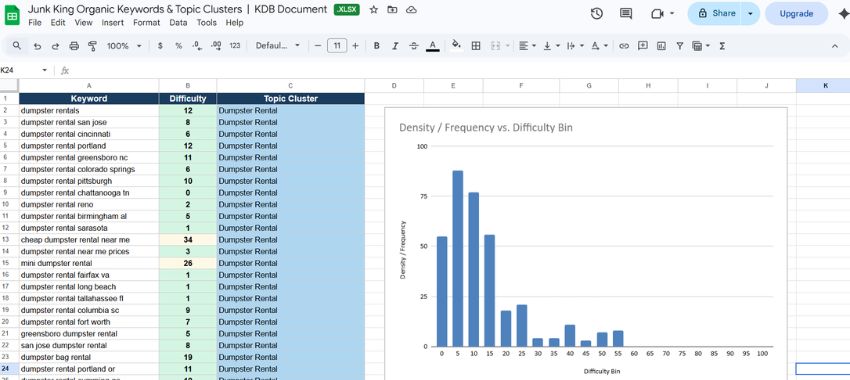
Here is a concrete example. Your site-wide baseline is 0 to 5. But when you break it down by cluster:
- Residential Junk Removal: median KD sits in the 0 to 5 bin
- Dumpster Rental. median sits in the KD 5 to 10 bin
Looking at both clusters side by side, the dumpster rental cluster is healthier from a targeting standpoint. It is more consistent, the KD ceiling is manageable, and the opportunity to scale through local pages is clear.
Armed with cluster-level baselines, you know exactly where to push harder and where to stay patient. This level of precision is what separates a targeted keyword strategy from a generic one.
Step 5: Use the Baseline to Filter Keyword Opportunities
Now the baseline becomes an action filter. Here is the three-tier targeting model I use with every client:
Tier 1 — Quick Wins: Target keywords 10 to 15 points below your baseline if you can. In the Junk Kings case, the majority of the keyword opportunities fall between 0 and 5, and the data backs that up. 67.8% of the site’s 3,613 ranking keywords already fall in this range. New pages targeting keyword terms from 0 to 2, or optimization of existing ones, can produce ranking movement within 30 to 60 days.
Tier 2 — Stretch Targets: Keywords at your baseline up to 10 points above it. Junk Kings stretch targets KD 5 to 15. With solid content, proper on-page optimization, and strong internal linking from the site’s existing authority, and targeted link building, expect meaningful ranking movement within 120 days.
Tier 3 — Aspirational: Keywords 10 to 25 points above your baseline. For Junk King, this means KD 15 to 30. Getting to page one and staying there requires stronger content investment and a deliberate link-building strategy. Plan for 5 to 8 months before seeing any meaningful ranking movement.
How to Use Your Baseline to Find Quick-Win Content Gap Keywords
Here is the full workflow from baseline to keyword target list.
Before running a content gap analysis, make sure your existing pages are optimized. A website content audit will show you which pages are worth strengthening before you start targeting new keywords. Start with the content gap analysis in Ahrefs. Enter your domain, add two or three direct competitors, and run the report. You will get a list of every keyword those competitors rank for that your site does not.
Filter the results to your Tier 1 KD range, baseline minus 10 to 15 points, and set a minimum search volume of 100 monthly searches. That filter alone will cut the list down to the most actionable opportunities.
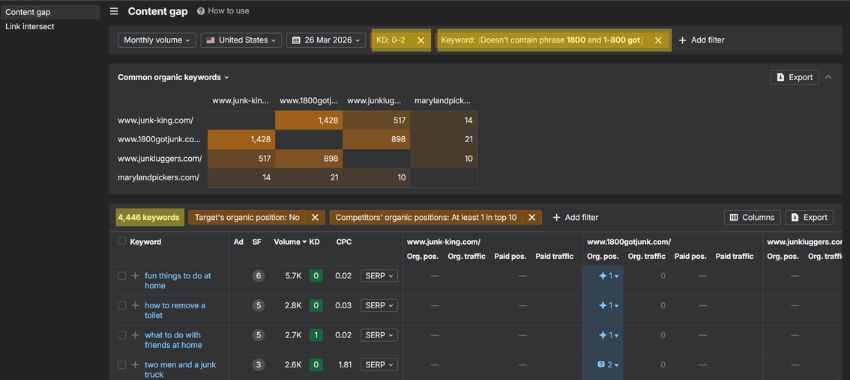
Here is an example of what this looks like in practice. Junk King’s baseline is 0 to 5. We looked at three competitors: 1800 Got Junk, Junk Luggers, and MarylandPickers. We ran the analysis and found 4,446 non-branded keywords in that 0 to 2 difficulty range that competitors ranked for on the first page of search results, and Junk King does not.
Now cross-reference that list against search intent. Group the keywords by intent, informational, commercial, transactional, and prioritize the commercial and transactional terms first. Those are the keywords most closely related to revenue.
Beyond KD Scores: Contextual Factors That Affect Real Difficulty
KD scores are a starting point, not a final answer. Before you commit to a keyword target, layer in these contextual checks:
- Domain Rating and topical authority: A site with strong topical authority in a specific niche can often rank for keywords above its baseline in that topic area. This is exactly why cluster-level baselines matter.
- Content quality of the current top 10: Open the top five ranking pages for your target keyword and read them. If they are thin, outdated, or poorly structured, a higher KD score is misleading. The competition is most likely beatable regardless of the number.
- SERP feature presence: A keyword with a featured snippet, People Also Ask boxes, and an AI Overview is a fundamentally different target than the old clean ten-blue-links result. More SERP features mean less real estate for organic clicks.
- Seasonality: A keyword with 2,000 monthly searches in November and 200 in March needs to be evaluated on its peak-month volume, not its annual average.
- Trending queries: A keyword with accelerating search volume and a KD score that hasn’t caught up yet is a genuine opportunity. Ahrefs flags these with a trend indicator in the Keywords Explorer.
Keyword Difficulty in the Age of AI Overviews: Why Traditional KD Scores Aren’t Enough
Here is something no KD score accounts for: whether the person searching will actually click on an organic result.
AI Overviews have changed the click-through equation in a measurable way. Studies show that AI-generated answers at the top of the SERP significantly reduce organic clicks, particularly on informational queries. A KD-15 keyword that triggers a comprehensive AI Overview at the top of the SERP may deliver a fraction of the clicks you would expect based on search volume alone. Google’s AI answers the question directly, and a meaningful percentage of searchers never scroll past it.
This introduces what I think of as effective difficulty, a combination of ranking difficulty and click probability. A KD of 25 on a keyword with no AI Overview presence and strong commercial intent may be a better target than a KD of 15 on a purely informational query that triggers an AI answer every time.
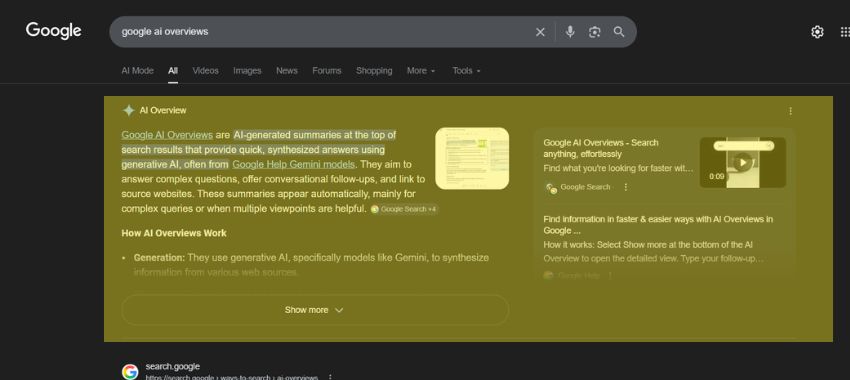
Here is how to check for AI Overview presence before committing to a keyword target:
Search the keyword in Google from an incognito window. Note whether an AI Overview appears at the top of the results. If it does, assess whether the AI answer is comprehensive or partial. A comprehensive AI answer on an informational query kills click-through. A partial answer on a commercial query, where the searcher still needs to evaluate options, canleave significant organic traffic on the table.
Keywords most vulnerable to AI Overview click erosion:
- Simple definitional queries (“what is X”)
- How-to queries with straightforward answers
- Fact-based informational queries
Keywords that still drive strong clicks despite AI Overviews:
- Commercial comparison queries (“X vs Y”)
- Product and service research queries
- Local intent queries
- Queries where the searcher needs to see multiple perspectives or read in depth
Factor this into your keyword prioritization. A Tier 1 keyword with an AI Overview is still worth targeting for brand visibility and citation potential, but do not build traffic projections based on its raw search volume.
How to Recalibrate Your Baseline as Your Site Grows
Your baseline is not a number you calculate once and file away. It is a living metric. As your site earns authority, publishes more content, and builds more backlinks, your ability to compete for harder keywords increases, and your baseline should reflect that.
Recalculate your baseline every six months to a year. Here is what a healthy growth trajectory looks like in practice:
| Timeframe | Baseline KD | What’s Driving the Shift |
|---|---|---|
| Launch | 8–12 | Targeting very low competition, niche long-tail terms |
| Month 12 | 18–22 | Early content gains, some link acquisition |
| Month 24 | 28–32 | Topical authority building, consistent publishing |
| Month 36 | 36–42 | Established authority in core topic clusters |
| Month 48+ | 45–55 | Competing in earnest with established players |
As your baseline rises, shift your targeting tiers upward. What was a Tier 3 aspirational target at month six becomes a Tier 1 quick win at month 24. This is how keyword strategy compounds, and why documenting your baseline quarterly gives you a clear picture of whether your SEO investment is producing real authority gains or just traffic noise.
If your baseline is not moving after 12 months of consistent content production, that is a signal worth investigating. It usually points to one of three things: insufficient link building, weak topical focus, or content that is not genuinely competitive on quality. The baseline does not lie.

Common Keyword Difficulty Mistakes (and How to Avoid Them)
Targeting keywords that are too challenging is the most common mistake I see in organic search strategies, but it is not the only one.
Targeting above your baseline without a link building plan. Stretch targets require link equity to compete. If you are publishing content above your baseline range without actively building backlinks, you are producing content that will sit on page three indefinitely.
Relying on a single KD score without cross-referencing. KD is an estimate. Before committing to a keyword, open the actual SERP and look at what is ranking. If the top five results are all from Forbes, HubSpot, and Salesforce, a KD of 35 is misleading. The qualitative SERP review catches what the score misses.
Mixing KD scores from different tools. A KD of 40 in Ahrefs is not the same as a KD of 40 in Semrush. Pick one tool and use it exclusively across your entire baseline calculation. This is non-negotiable.
Ignoring search intent. A low-KD keyword that does not align with your content type is not a quick win. It is a mismatch. Match keyword intent to page type before you add anything to your content roadmap.
Treating your baseline as static. Your baseline from 18 months ago is not your baseline today. Sites that fail to recalibrate quarterly end up either over-targeting, chasing keywords they have grown past, or under-targeting, leaving easy wins on the table because they are still anchored to an old number.
Not accounting for AI Overviews when assessing keyword value. A low-KD keyword with a comprehensive AI Overview at the top of the SERP will not deliver the traffic its search volume suggests. Factor click probability into your targeting decisions, not just difficulty and volume.